Hello Readers
it has been a long time since my last post, I was a little bit busy.
This time I want to present some experimental code to visualize and analyze G-Sensor data. The goal was to achieve a shake detection algorithm. Unfortunately the device under test only provided 1 sample per second and that is not enough for a good shake detection. Beside that the code and classes developed may help you to find your way and they help you at last to determine the current orientation of the device.
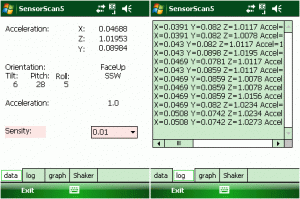
left shows general information taken from vector, right shows a log with last vector data

[image SensorScan5_0102.gif]

[image SensorScan5_0304.gif]
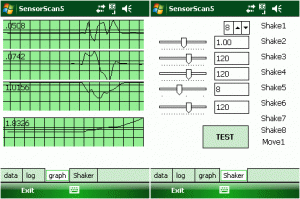
left shows graphical of vector and force (length), right shows indicators for detected events
A g-sensor or accelerometer sensor normally gives you the x, y and z-values of a vector. A vector is an imaginary arrow with a direction and length starting from the three dimensional point 0,0,0. The vector direction points to the acceleration of the device. The normal acceleration on earth is 9,81m/s^2. If the device is on the desk, the y-acceleration is about minus 9.81m/s^2. The absolute value of the sensor may vary on the sensor and maybe defined as 1.0 for -9.81m/s^2 or -0.981. If you through the device up to the air, the x,y and z-values will reach 0,0,0 as if the device is weightless. Keep in mind that the acceleration towards the middle of the earth is always there and the device will come back to you.
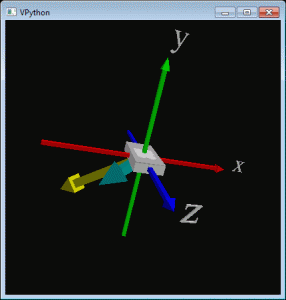
Here is another visualization of the vector and a device (done with visual python, [Download not found]):

[image vectors.gif]
The device is facing upwards (see y arrow) with the top facing to you (the z arrow). The left side of the device is pointing to the right (the x arrow).
The light green/blue and the yellow arrows demonstrate two different vectors which show the direction (the xyz angles) and the force (the vector lengths) to the device.
Continue reading ‘Mobile Development – Shake that thing’ »


 http://www.led-mg.de